
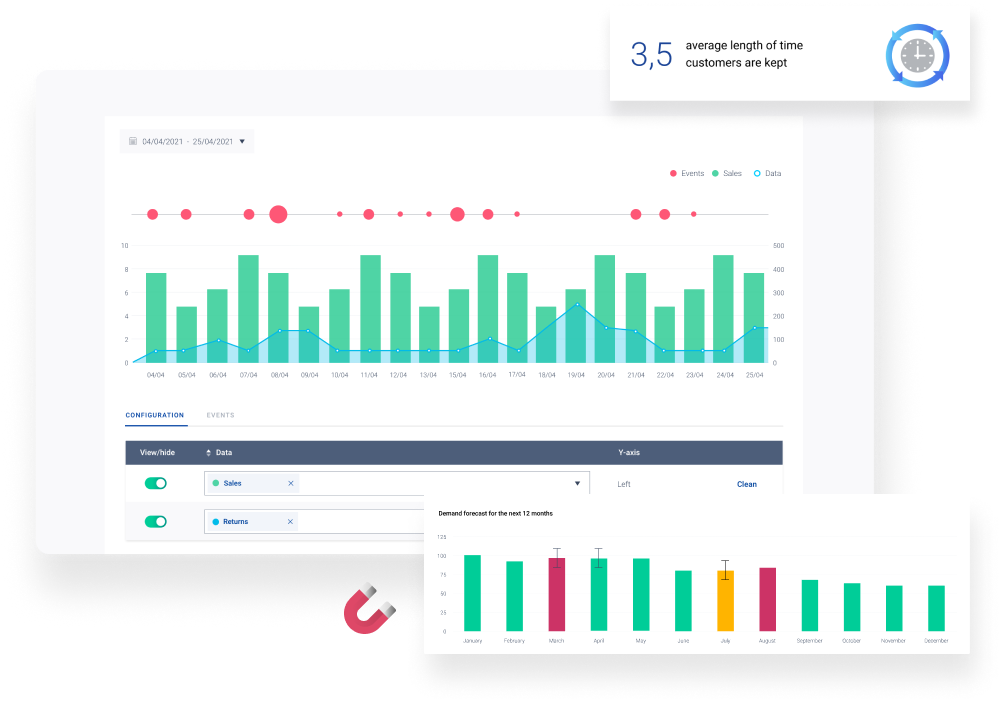
You learn about trends when they're already history
The monthly report arrives after the opportunity has passed, the sales drop is explained three weeks late, and the relationship between what you invest and what you sell is sensed but not proven. Trends turns that fog into timely signals.
Three steps, from data to signal
Your KPIs, beating in real time
Sales, orders, average ticket, active customers: your business indicators update in real time and compare themselves against yesterday, last week or last year. With alerts when something deviates from expectations.
Discover what moves what
Trends combines your metrics and shows you the relationships you can't see at a glance: how paid investment pushes in-store sales, how weather affects your category, what accompanies each spike. Decisions with cause, not hunch.
Tomorrow's demand, today
FLYDE's forecasting models project your sales and demand by product, category or channel, with their confidence band. Inventory, purchasing and campaigns stop lagging behind the market.
AI demand forecasting
Trends forecasting relies on FLYDE's machine learning models trained on your own data: seasonality, trend and your customers' real behavior. And when you want to go further, the full Predict Pack awaits.
What's in your panel
Real-time KPIs
Your key business indicators, always up to date and compared.
Deviation alerts
Alerts when a metric moves outside its expected behavior.
Correlations between metrics
Statistical relationships between your variables, detected and measured.
Seasonality
Weekly, monthly and yearly patterns of your business, isolated.
Period comparisons
Any metric against any period, in one click.
Demand forecasting
Projections by product, category and channel with a confidence band.
Put the results to work in the rest of the apps
Trends is the compass: what it anticipates turns into audiences, campaigns and decisions in the rest of the apps.
 Core
Core Customer 360
 Market
 Analytics